Online shop
Peonia Floristikatelier
Bespoke floristry studio in Baden-Baden
- Next.js
- Katalog
- WhatsApp-Bestellstrecke
Software
Yield forecasting for solar parks from GIS data
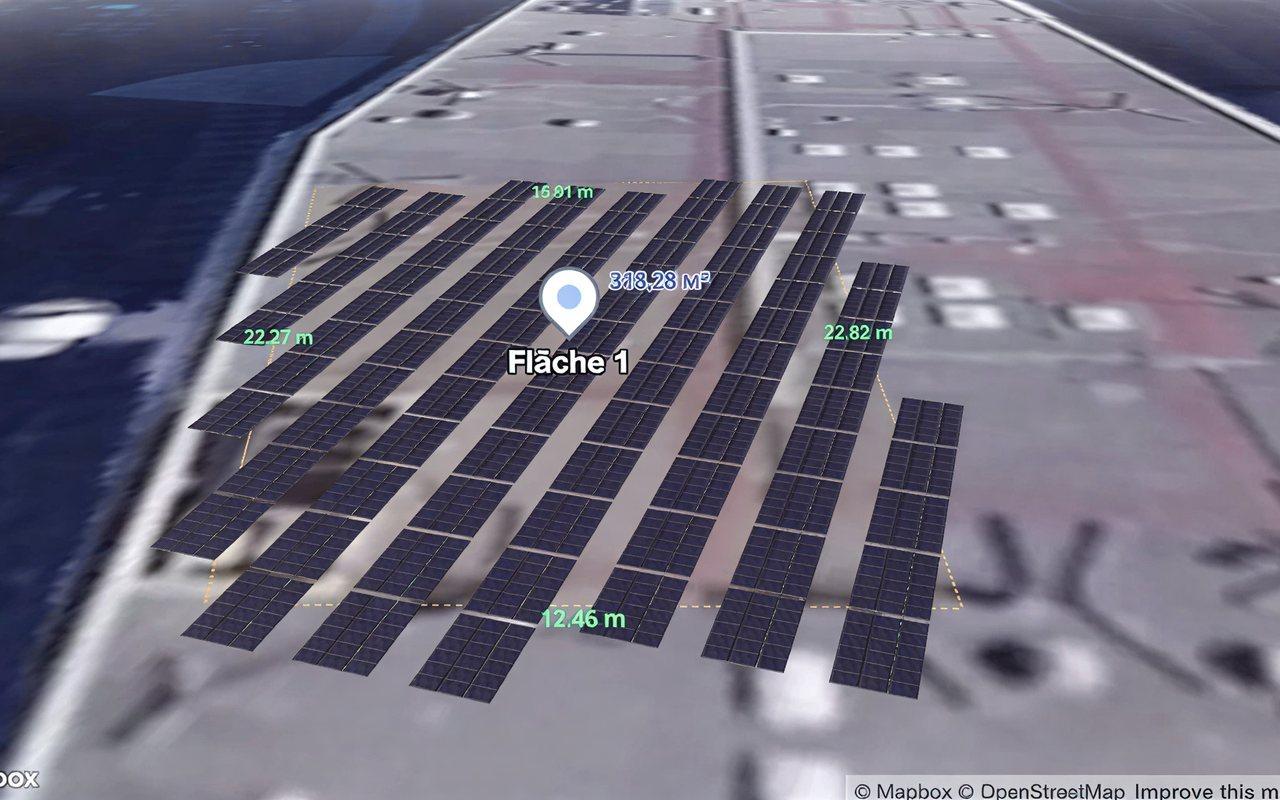
Whether a site carries a solar park is decided before the first module goes up. Answering that with rules of thumb, or a single year of weather data, means investing on a hunch — and finding out only once the plant is built.
The platform puts the site on a 3D map: users draw the area, the system measures it, lays out the modules and calculates the expected yield. The basis is a GIS-backed analysis of ten years of weather data for that exact location, not a regional average. That makes several sites comparable before any money moves.
Let's talk
Even if your case does not appear anywhere on this site: describe it. If we are not the right people for it, we will say so in the first conversation — and tell you who we would recommend instead.
We usually reply within 24 hours. No sales pitch, no mandatory subscription.